Pandas and Tidy Data

In the paper Tidy Data, Dr. Wickham proposed a specific form of data structure: each variable is a column, each observation is a row, and each type of observational unit is a table. He argued that with tidy data, data analysts can manipulate, model, and visualize data more easily and effectively. He lists five common data structures that are untidy, and demonstrates how to use R language to tidy them. In this article, we’ll use Python and Pandas to achieve the same tidiness.

Source code and demo data can be found on GitHub (link), and readers are supposed to have Python environment installed, preferably with Anaconda and Spyder IDE.

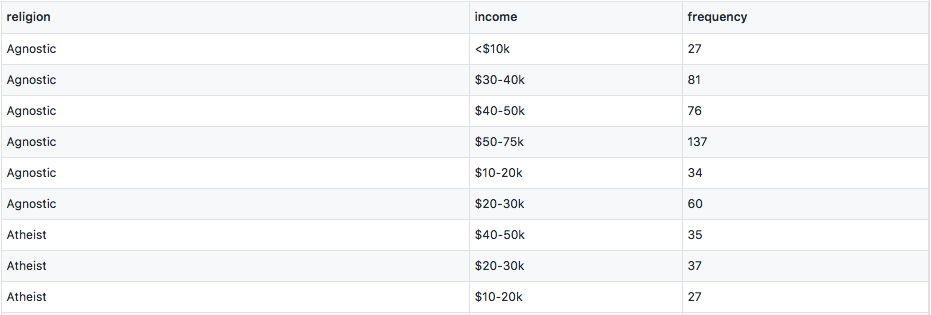
Column headers are values, not variable names

1
2
3
import pandas as pd
df = pd.read_csv('data/pew.csv')
df.head(10)

Religion and Income - Pew Forum

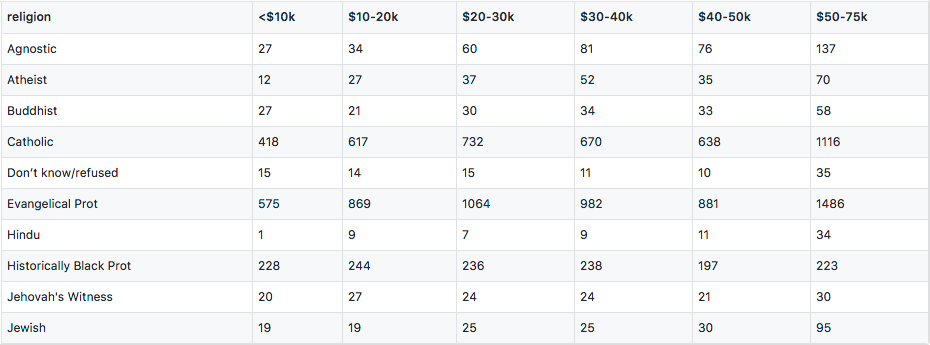
Column names “<$10k”, “$10-20k” are really income ranges that constitutes a variable. Variables are measurements of attributes, like height, weight, and in this case, income and religion. The values within the table form another variable, frequency. To make each variable a column, we do the following transformation:

1
2
3
4
5
6
df = df.set_index('religion')
df = df.stack()
df.index = df.index.rename('income', level=1)
df.name = 'frequency'
df = df.reset_index()
df.head(10)

Religion and Income - Tidy

Read More

Apache Beam Quick Start with Python

Apache Beam is a big data processing standard created by Google in 2016. It provides unified DSL to process both batch and stream data, and can be executed on popular platforms like Spark, Flink, and of course Google’s commercial product Dataflow. Beam’s model is based on previous works known as FlumeJava and Millwheel, and addresses solutions for data processing tasks like ETL, analysis, and stream processing. Currently it provides SDK in two languages, Java and Python. This article will introduce how to use Python to write Beam applications.

Apache Beam Pipeline

Installation

Apache Beam Python SDK requires Python 2.7.x. You can use pyenv to manage different Python versions, or compile from source (make sure you have SSL installed). And then you can install Beam SDK from PyPI, better in a virtual environment:

1
2
3
$ virtualenv venv --distribute
$ source venv/bin/activate
(venv) $ pip install apache-beam

Read More

Hive Window and Analytical Functions

SQL is one of the major tools of data analysis. It provides filtering, transforming and aggregation functionalities, and we can use it to process big volume of data with the help of Hive and Hadoop. However, legacy SQL does not support operations like grouped ranking and moving average, because the GROUP BY clause can only produce one aggregation result for each group, but not for each row. Fortunately, with the new SQL standard coming, we can use the WINDOW clause to compute aggregations on a set of rows and return the result for each row.

Moving Average

For instance, if we want to calculate the two-day moving average for each stock, we can write the following query:

1
2
3
4
5
6
SELECT
`date`, `stock`, `close`
,AVG(`close`) OVER `w` AS `mavg`
FROM `t_stock`
WINDOW `w` AS (PARTITION BY `stock` ORDER BY `date`
ROWS BETWEEN 1 PRECEDING AND CURRENT ROW)

OVER, WINDOW and ROWS BETWEEN AND are all newly added SQL keywords to support windowing operations. In this query, PARTITION BY and ORDER BY works like GROUP BY and ORDER BY after the WHERE clause, except it doesn’t collapse the rows, but only divides them into non-overlapping partitions to work on. ROWS BETWEEN AND here constructs a window frame. In this case, each frame contains the previous row and current row. We’ll discuss more on frames later. Finally, AVG is a window function that computes results on each frame. Note that WINDOW clause can also be directly appended to window function:

1
SELECT AVG(`close`) OVER (PARTITION BY `stock`) AS `mavg` FROM `t_stock`;

Read More

An Introduction to stream-lib The Stream Processing Utilities

When processing a large amount of data, certain operations will cost a lot of time and space, such as counting the distinct values, or figuring out the 95th percentile of a sequence of numbers. But sometimes the accuracy is not that important. Maybe you just want a brief summary of the dataset, or it’s a monitoring system, where limited error rate is tolerable. There’re plenty of such algorithms that can trade accuracy with huge saves of time-space. What’s more, most of the data structures can be merged, making it possible to use in stream processing applications. stream-lib is a collection of these algorithms. They are Java implementations based on academical research and papers. This artile will give a brief introduction to this utility library.

Count Cardinality with HyperLogLog

Unique visitors (UV) is the major metric of websites. We usually generate UUIDs for each user and track them by HTTP Cookie, or roughly use the IP address. We can use a HashSet to count the exact value of UV, but that takes a lot of memory. With HyperLogLog, an algorithm for the count-distinct problem, we are able to estimate cardinalities of > 10^9 with a typical accuracy of 2%, using 1.5 kB of memory.

1
2
3
4
5
<dependency>
<groupId>com.clearspring.analytics</groupId>
<artifactId>stream</artifactId>
<version>2.9.5</version>
</dependency>
1
2
3
4
5
ICardinality card = new HyperLogLog(10);
for (int i : new int[] { 1, 2, 3, 2, 4, 3 }) {
card.offer(i);
}
System.out.println(card.cardinality()); // 4

Read More

Extract Data from MySQL with Binlog and Canal

Data extraction is the very first step of an ETL process. We need to load data from external data stores like RDMBS or logging file system, and then we can do cleaning, transformation and summary. In modern website stack, MySQL is the most widely used database, and it’s common to extract data from different instances and load into a central MySQL database, or directly into Hive. There’re several query-based techniques that we can use to do the extraction, including the popular open source software Sqoop, but they are not meant for real-time data ingestion. Binlog, on the other hand, is a real-time data stream that is used to do replication between master and slave instances. With the help of Alibaba’s open sourced Canal project, we can easily utilize the binlog facility to do data extraction from MySQL database to various destinations.

Canal

Canal Components

In brief, Canal simulates itself to be a MySQL slave and dump binlog from master, parse it, and send to downstream sinks. Canal consists of two major components, namely Canal server and Canal client. A Canal server can connect to multiple MySQL instances, and maintains an event queue for each instance. Canal clients can then subscribe to theses queues and receive data changes. The following is a quick start guide to get Canal going.

Read More

How to Extract Event Time in Apache Flume

Extracting data from upstream message queues is a common task in ETL. In a Hadoop based data warehouse, we usually use Flume to import event logs from Kafka into HDFS, and then run MapReduce jobs agaist it, or create Hive external tables partitioned by time. One of the keys of this process is to extract the event time from the logs, since real-time data can have time lags, or your system is temporarily offline and need to perform a catch-up. Flume provides various facilities to help us do this job easily.

Apache Flume

HDFS Sink and Timestamp Header

Here is a simple HDFS Sink config:

1
2
3
a1.sinks = k1
a1.sinks.k1.type = hdfs
a1.sinks.k1.hdfs.path = /user/flume/ds_alog/dt=%Y%m%d

%Y%m%d is the placeholders supported by this sink. It will use the milliseconds in timestamp header to replace them. Also, HDFS Sink provides hdfs.useLocalTimeStamp option so that it’ll use the local time to replace these placeholders, but this is not what we intend.

Another sink we could use is the Hive Sink, which directly communicates with Hive metastore and loads data into HDFS as Hive table. It supports both delimited text and JSON serializers, and also requires a timestamp header. But we don’t choose it for the following reasons:

  • It doesn’t support regular expression serializer, so we cannot extract columns from arbitrary data format like access logs;
  • The columns to be extracted are defined in Hive metastore. Say the upstream events add some new keys in JSON, they will be dropped until Hive table definition is updated. As in data warehouse, it’s better to preserve the original source data for a period of time.

Read More

How to Achieve Exactly-Once Semantics in Spark Streaming

Exactly-once semantics is one of the advanced topics of stream processing. To process every message once and only once, in spite of system or network failure, not only the stream processing framework needs to provide such functionality, but also the message delivery system, the output data store, as well as how we implement the processing procedure, altogether can we ensure the exactly-once semantics. In this article, I’ll demonstrate how to use Spark Streaming, with Kafka as data source and MySQL the output storage, to achieve exactly-once stream processing.

Spark Streaming

An Introductory Example

First let’s implement a simple yet complete stream processing application that receive access logs from Kafka, parse and count the errors, then write the errors per minute metric into MySQL database.

Sample access logs:

1
2
3
2017-07-30 14:09:08 ERROR some message
2017-07-30 14:09:20 INFO some message
2017-07-30 14:10:50 ERROR some message

Output table, where log_time should be truncated to minutes:

1
2
3
4
create table error_log (
log_time datetime primary key,
log_count int not null default 0
);

Read More

Learn Pandas from a SQL Perspective

Pandas is a widely used data processing tool for Python. Along with NumPy and Matplotlib, it provides in-memory high-performance data munging, analyzing, and visualization capabilities. Although Python is an easy-to-learn programming language, it still takes time to learn Pandas APIs and the idiomatic usages. For data engineer and analysts, SQL is the de-facto standard language of data queries. This article will provide examples of how some common SQL queries can be rewritten with Pandas.

The installation and basic concepts of Pandas is not covered in this post. One can check out the offical documentation, or read the book Python for Data Analysis. And I recommend using the Anaconda Python distribution, with Spyder IDE included. Before diving into the codes, please import Pandas and NumPy as follows:

1
2
import pandas as pd
import numpy as np

FROM - Load Data into Memory

First of all, let’s read some data into the workspace (memory). Pandas supports a variety of formats, one of them is CSV. Take the following flight delay dataset for example (link):

1
2
3
4
date,delay,distance,origin,destination
02221605,3,358,BUR,SMF
01022100,-5,239,HOU,DAL
03210808,6,288,BWI,ALB

We can use pd.read_csv to load this file:

1
2
df = pd.read_csv('flights.csv', dtype={'date': str})
df.head()

This statement will load flights.csv file into memory, use first line as column names, and try to figure out each column’s type. Since the date column is in %m%d%H%M format, we don’t want to lose the initial 0 in month, so we pass an explict dtype for it, indicating that this column should stay unparsed.

Read More

Log Tailer with WebSocket and Python

Tailing a log file is a common task when we deploy or maintain some software in production. Instead of logging into the server and tail -f, it would be nice if we can tail a log file in the browser. With WebSocket, this can be done easily. In this article, I’ll walk you through a simple logviewer (source) utility that is written in Python.

Logviewer with WebSocket

WebSocket Intro

WebSocket is standard protocol over TCP, that provides full-duplex communication between client and server side, usually a browser and a web server. Before WebSocket, when we want to keep an alive browser-server connection, we choose from long polling, forever frame or Comet techniques. Now that WebSocket is widely supported by major browsers, we can use it to implement web chatroom, games, realtime dashboard, etc. Besides, WebSocket connection can be established by an HTTP upgrade request, and communicate over 80 port, so as to bring minimum impact on existing network facility.

Read More

Build Interactive Report with Crossfilter and dc.js

When visualizing multidimensional datasets, we often want to connect individual charts together, so that one chart’s filter will apply to all the other charts. We can do it manually, filter data on the server side, and update the rendered charts. Or we can filter data on the client side, and let charts update themselves. With Crossfilter and dc.js, this work becomes simple and intuitive.

Airline On-time Performance

Here’s an example taken from Crossfilter’s official website. It’s a flight delay analysis report based on ASA Data Expo dataset. And this post will introduce how to use dc.js to build the report. A runnable JSFiddle can be found here, though the dataset is reduced to 1,000 records.

Read More