When processing a large amount of data, certain operations will cost a lot of time and space, such as counting the distinct values, or figuring out the 95th percentile of a sequence of numbers. But sometimes the accuracy is not that important. Maybe you just want a brief summary of the dataset, or it’s a monitoring system, where limited error rate is tolerable. There’re plenty of such algorithms that can trade accuracy with huge saves of time-space. What’s more, most of the data structures can be merged, making it possible to use in stream processing applications. stream-lib is a collection of these algorithms. They are Java implementations based on academical research and papers. This artile will give a brief introduction to this utility library.
Count Cardinality with HyperLogLog
Unique visitors (UV) is the major metric of websites. We usually generate UUIDs for each user and track them by HTTP Cookie, or roughly use the IP address. We can use a HashSet to count the exact value of UV, but that takes a lot of memory. With HyperLogLog, an algorithm for the count-distinct problem, we are able to estimate cardinalities of > 10^9 with a typical accuracy of 2%, using 1.5 kB of memory.
1 | <dependency> |
1 | ICardinality card = new HyperLogLog(10); |
HyperLogLog estimates cardinality by counting the leading zeros of each member’s binary value. If the maximum count is n, the cardinality is 2^n. There’re some key points in this algorithm. First, members needs to be uniformly distributed, which we can use a hash function to achieve. stream-lib uses MurmurHash, a simple, fast, and well distributed hash function, that is used in lots of hash-based lookup algorithms. Second, to decrease the variance of the result, set members are splitted into subsets, and the final result is the harmonic mean of all subsets’ cardinality. The integer argument that we passed to HyperLogLog constructor is the number of bits that it’ll use to split subsets, and the accuracy can be derived from this formula: 1.04/sqrt(2^log2m).
HyperLogLog is an extension of LogLog algorithm, and the HyperLogLogPlus makes some more improvements. For instance, it uses a 64 bit hash function to remove the correction factor that adjusts hash collision; for small cardinality, it applies an empirical bias correction; and it also supports growing from a sparse data strucutre of registers (holding subsets) to a dense one. These algorithms are all included in stream-lib
Test Membership with BloomFilter
BloomFilter is a widely used data structure to test whether a set contains a certain member. The key is it will give false positive result, but never false negative. For example, Chrome maintains a malicious URLs in local storage, and it’s a bloom filter. When typing a new URL, if the filter says it’s not malicious, then it’s definitely not. But if the filter says it is in the set, then Chrome needs to contact the remote server for further confirmation.
1 | Filter filter = new BloomFilter(100, 0.01); |
The contruction process of a bloom filter is faily simple:
- Create a bit array of
nbits. In Java, we can use theBitSetclass. - Apply
knumber of hash functions to the incoming value, and set the corresponding bits to true. - When testing a membership, apply those hash functions and get the bits’ values:
- If every bit hits, the value might be in the set, with a False Positive Probability (FPP);
- If not all bits hit, the value is definitely not in the set.
Again, those hash functions need to be uniformly distributed, and pairwise independent. Murmur hash meets the criteria. The FPP can be calculated by this formula: (1-e^(-kn/m))^k. This page (link) provides an online visualization of bloom filter. Other use cases are: anti-spam in email service, non-existent rows detection in Cassandra and HBase, and Squid also uses it to do cache digest.
Top-k Elements with CountMinSketch
CountMinSketch is a “sketching” algorithm that uses minimal space to track frequencies of incoming events. We can for example find out the top K tweets streaming out of Twitter, or count the most visited pages of a website. The “sketch” can be used to estimate these frequencies, with some loss of accuracy, of course.
The following snippet shows how to use stream-lib to get the top three animals in the List:
1 | List<String> animals; |
CountMinSketch#estimateCount is a point query that asks for the count of an event. Since the “sketch” cannot remeber the exact events, we need to store them else where.
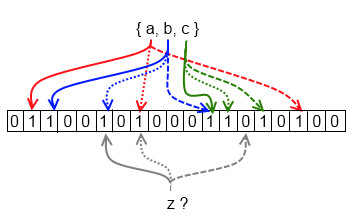
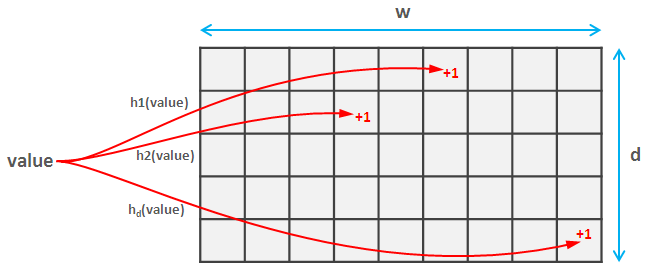
The data structure of count-min sketch is similar to bloom filter, instead of one bit array of w bits, it uses d number of them, so as to form a d x w matrix. When a value comes, it applies d number of hash functions, and update the corresponding bit in the matrix. These hash functions need only to be pairwise independent, so stream-lib uses a simple yet fast (a*x+b) mod p formula. When doing point query, calculate the hash values, and the smallest value is the frequency.
The estimation error is ε = e / w while probability of bad estimate is δ = 1 / e ^ d. So we can increase w and / or d to improve the results. Original paper can be found in this link.
Histogram and Quantile with T-Digest
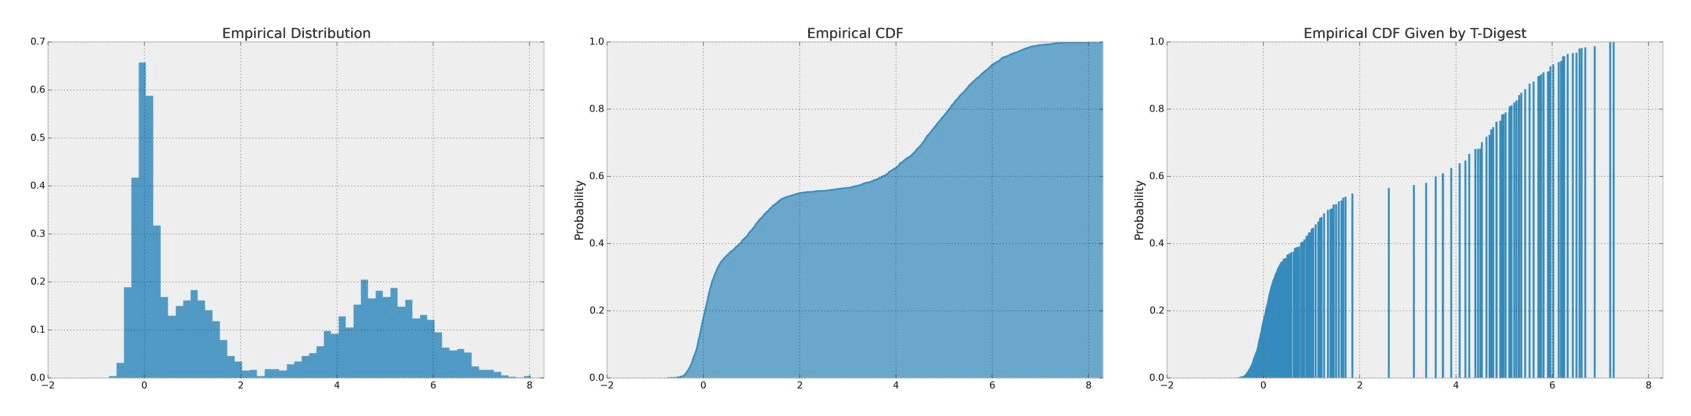
Median, 95th percentile are common use cases in descriptive statistics. Median for instance is less influenced by outliers than mean, but the calculation is not simple. One needs to track all data, sort them, and then get the final result. With T-Digest, we can agian generate a summarized distribution of the dataset and estimate the quantiles.
1 | Random rand = new Random(); |
The T-Digest paper can be found in this link. In brief, it uses a variant of 1-dimensional k-means clustering mechanism, representing the empirical distribution by retaining the centroids of subsets. Besides, different T-Digest instances can be merged into a larger, more accurate instance, which can be used in parallel processing with ease.
Conclusion
As we can see, most algorithms tries to save space and time with the cost of slight accuracy. By “sketching” the batch or streaming dataset, we can catch the “interesting” features and give very good estimation, especially when the dataset itself fullfills certain distribution. stream-lib and other opensourced projects certainly ease the process for us end users.