Pods running on Kubernetes may claim a Persistent Volume to store data that last between pod restarts. This volume is usually of limited size, so we need to monitor its storage and alert for low free space. For stateless pods, it is also necessary to monitor its disk usage, since the application within may write logs or other contents directly onto the Docker writable layer. In Kubernetes terms, this space is called ephemeral storage. Another way to prevent ephemeral storge from filling up is to monitor the nodes’ disk space directly. This article will demonstrate how to monitor volume storage with Prometheus.
Monitor Persistent Volume
kubelet exposes the following metrics for Persistent Volumes:
1 | $ curl http://10.0.0.1:10255/metrics |
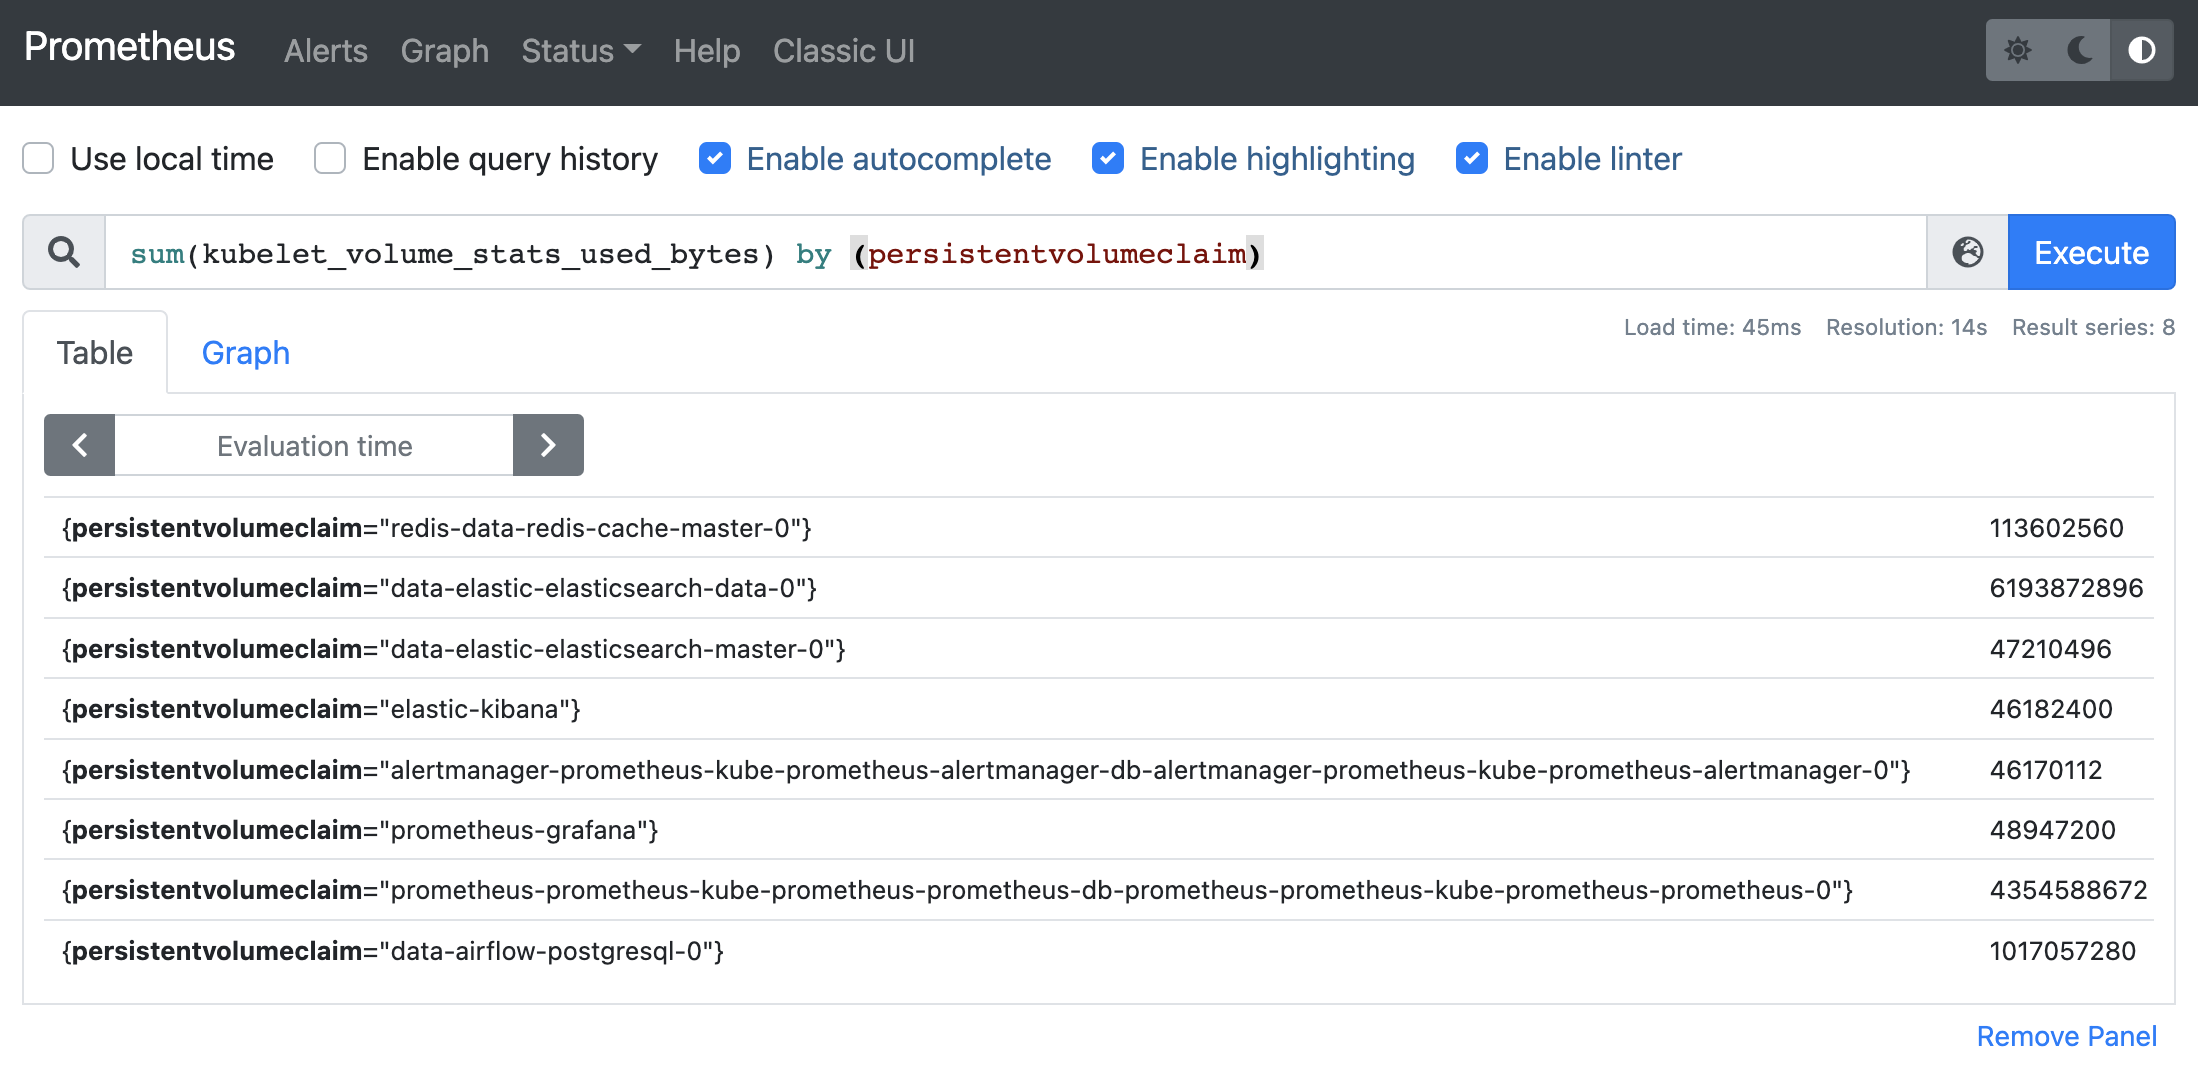
After you setup the Prometheus Stack with Helm chart, you will get a Service and ServiceMonitor that help scraping these metrics. Then they can be queried in Prometheus UI:
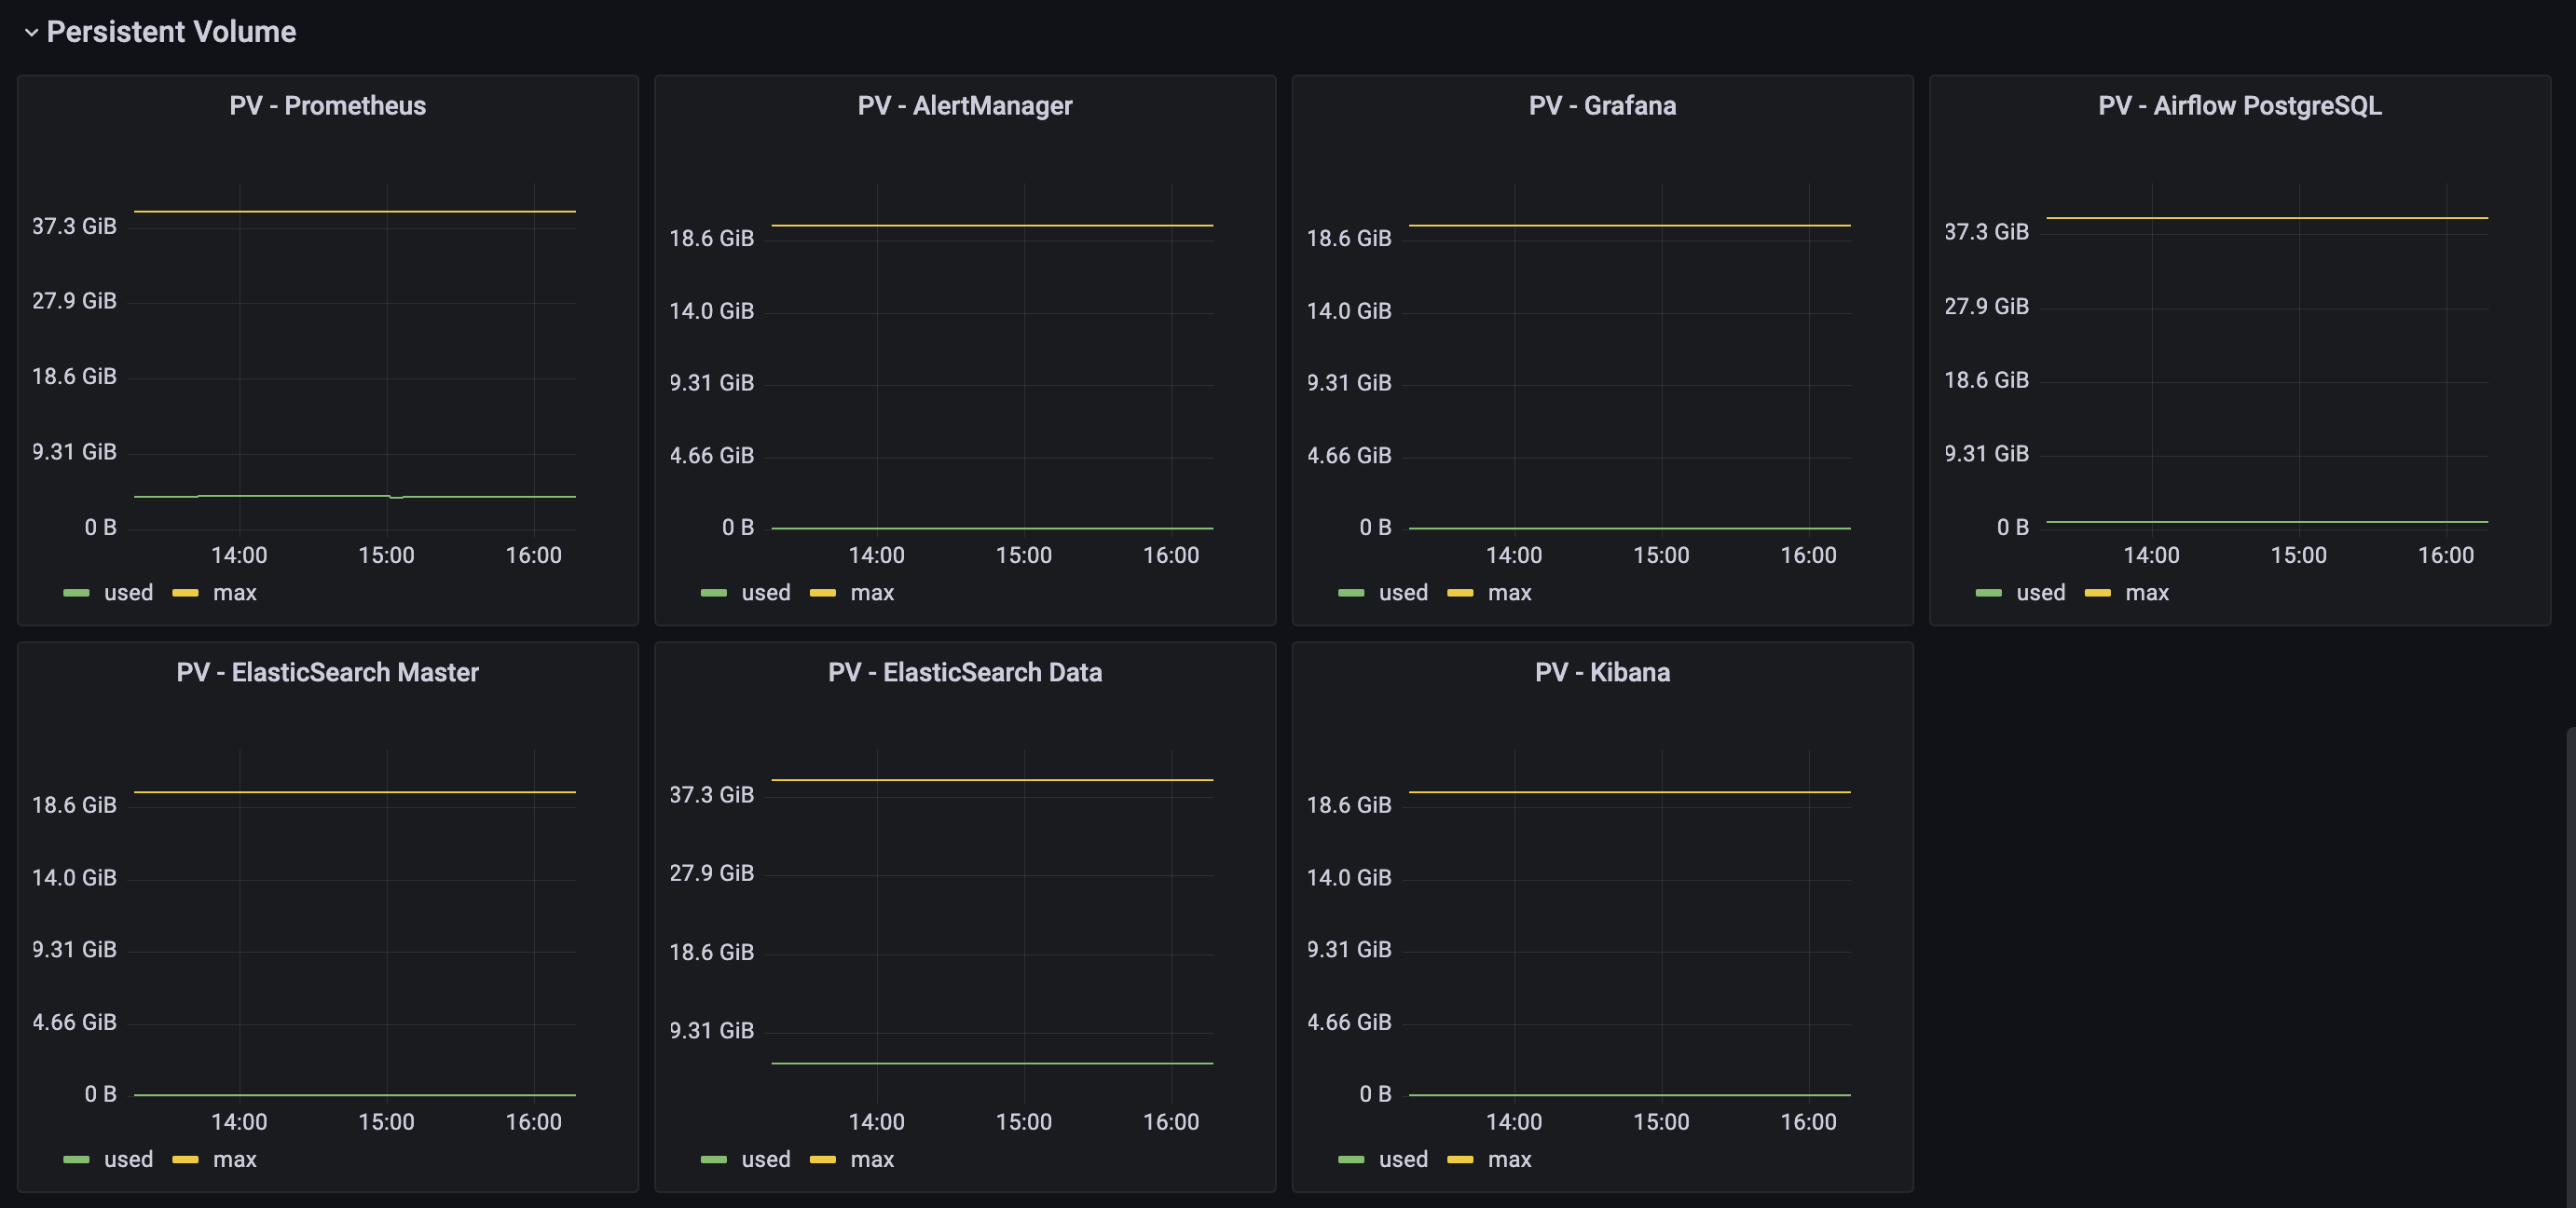
And visualized with Grafana:
Here is a simple alert rule that warns on disk usage:
1 | - alert: PrometheusPV |
Monitor Ephemeral Storage
According to Kubernetes documentation, ephemeral storage consists of emptyDir, logs, and the above-mentioned writable container layer. One can limit the use of ephemeral storage by configuring resources in container spec:
1 | kind: Pod |
kubelet integrates the cAdvisor (Container Advisor) utility, which exposes a series of container metrics:
| Metric name | Type | Description | Unit |
|---|---|---|---|
| container_fs_usage_bytes | Gauge | Number of bytes that are consumed by the container on this filesystem | bytes |
| container_memory_working_set_bytes | Gauge | Current working set | bytes |
| container_cpu_usage_seconds_total | Counter | Cumulative cpu time consumed | seconds |
| container_network_transmit_bytes_total | Counter | Cumulative count of bytes transmitted | bytes |
To get the limits we specified in pod spec, we need the help of kube-state-metrics that exposes a metric named kube_pod_container_resource_limits:
| Metric name | Value |
|---|---|
| kube_pod_container_resource_limits{exported_pod=”nginx-57bf55c5b5-n7vzp”, resource=”memory”, unit=”byte”} | 67108864 |
| kube_pod_container_resource_limits{exported_pod=”nginx-57bf55c5b5-n7vzp”, resource=”cpu”, unit=”core”} | 0.1 |
| kube_pod_container_resource_limits{exported_pod=”nginx-57bf55c5b5-n7vzp”, resource=”ephemeral_storage”, unit=”byte”} | 1073741824 |
If a pod is using more disk space than expected, it is usually because of application logs. One can adjust the log level, mount a dedicated PV for logging, or clear log files periodically. To temporarily solve the alert, just restart the Deployment or StatefulSet.
Monitor Node Disk Space
Though all cloud infrastructure providers have out-of-the-box warnings for virtual machines’ disk space, we can still setup our own graphs and alerts. Prometheus has built-in node-exporter metrics:
1 | sum( |